Signature · does it foot?
The balance-sheet scale
Assets on the left pan, liabilities and equity on the right. The beam sits level for every branch and every period — or the model is wrong.
1
Statement of condition
Balance Sheet
| Line ($M) | Δ |
|---|
2
Margin · 24 months
Net interest margin
Annualized NII over average earning assets, with the asset yield and cost of funds that drive it.
NIMEarning-asset yieldCost of funds
4
Statement of income
Income Statement
| Line ($M) | Δ |
|---|
3
Branch view · period end
Deposits and loans by office
Loans are booked where they were originated; deposits where the account is domiciled. Loan-to-deposit shown at right.
DepositsNet loans
5
Operating leverage · 24 months
Efficiency ratio
Non-interest expense divided by net interest income plus non-interest income. Lower is better.
6
What this board answers
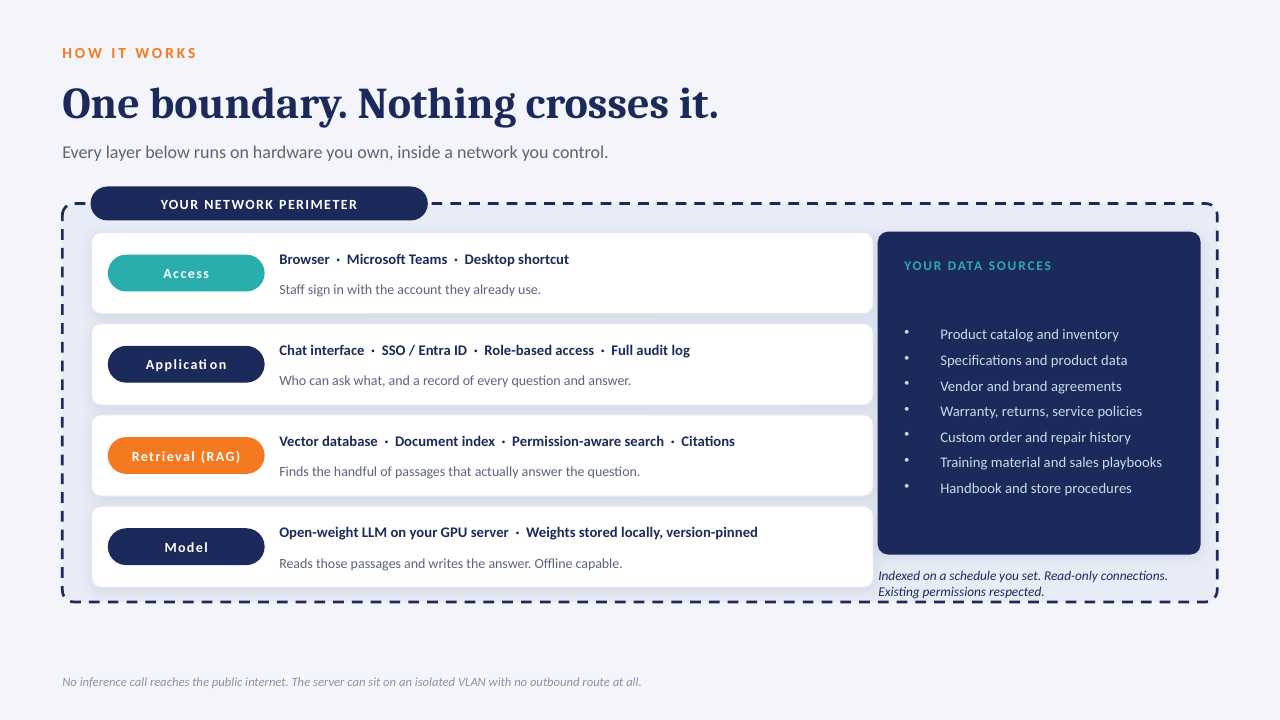
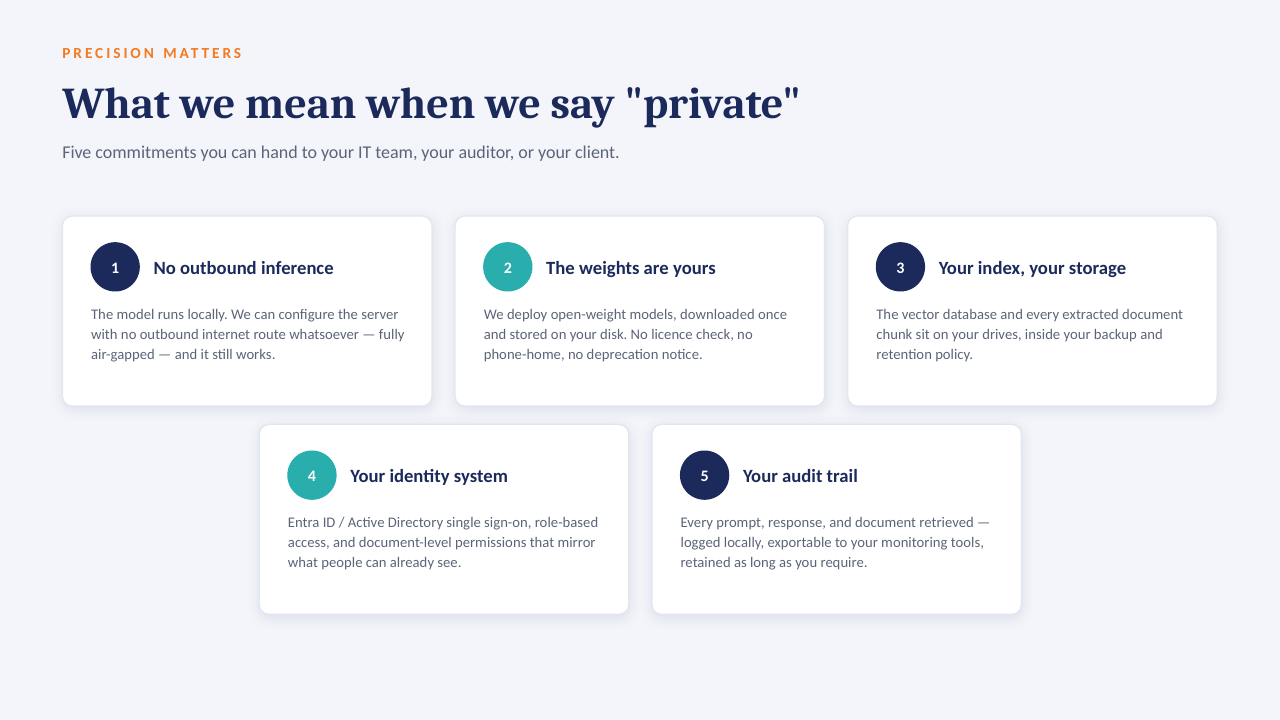
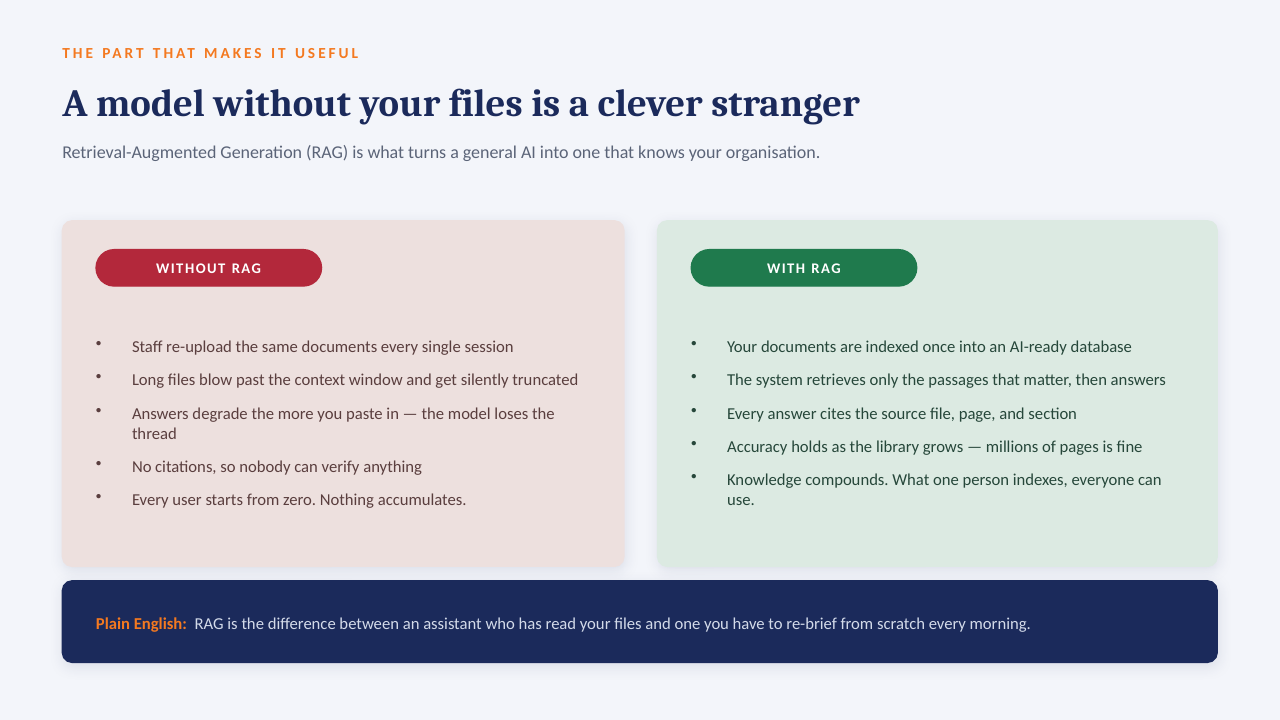
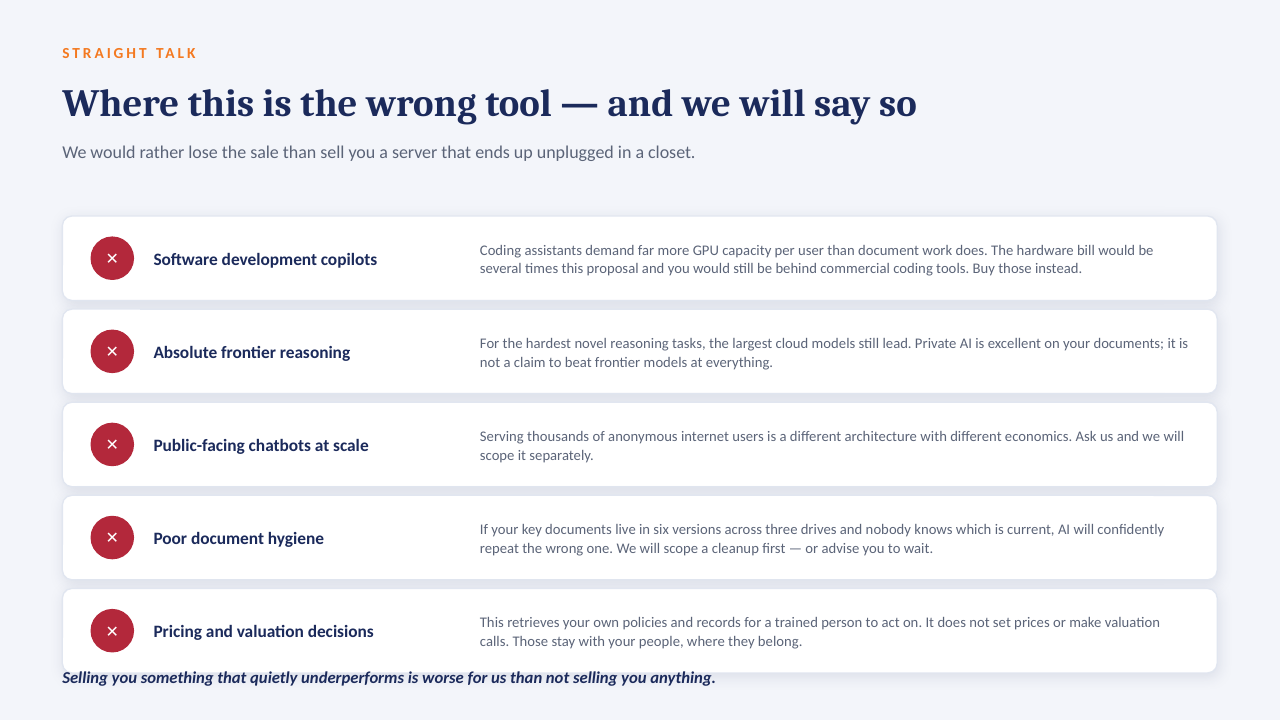
Three questions the CFO will ask
Ask the data · private AI over the semantic model
Plain-English questions, cited answers
Runs against the same Power BI model as the statements above — nothing leaves the bank's tenant.
QWhy did net interest margin fall in Q2 2026?
Sources checked: GL 4010–4190 interest income · GL 5010–5090 interest expense · Deposit subledger (product, rate, maturity) · FHLB advance schedule · Call Report Schedule RI & RC-E mapping.